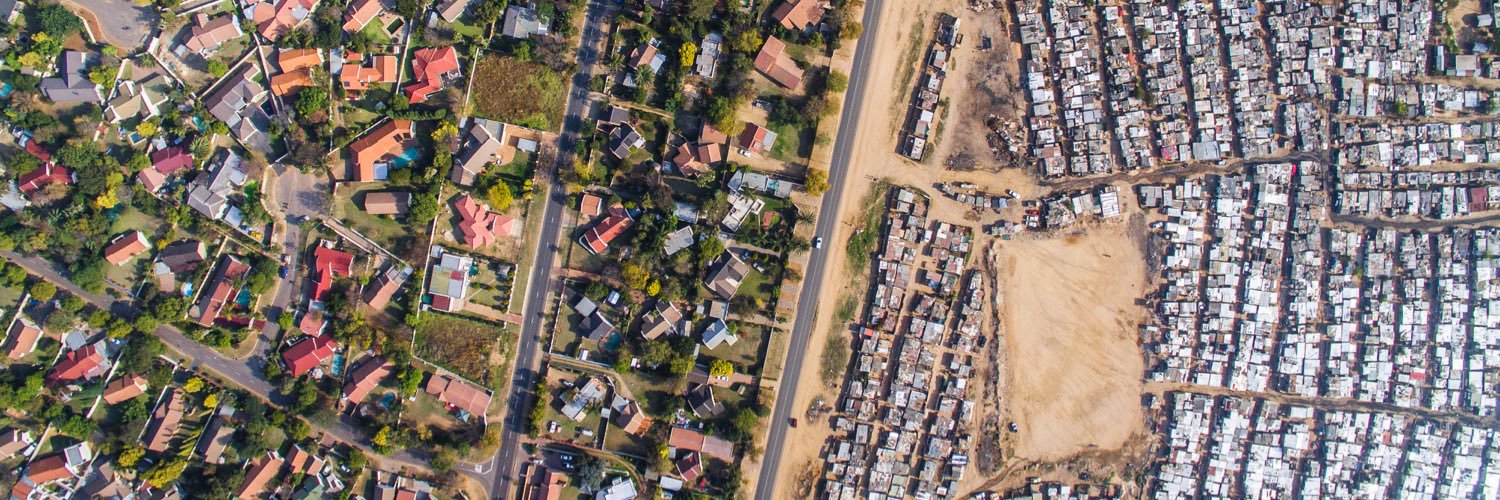
This Chartbook presents the empirical evidence about long-run changes in economic
inequality. The chartbook covers 25 countries – often over the course of more than one hundred years.
For each country a chart shows how different dimensions of economic inequality have changed over time. A
detailed description of the data sources is given for each country.
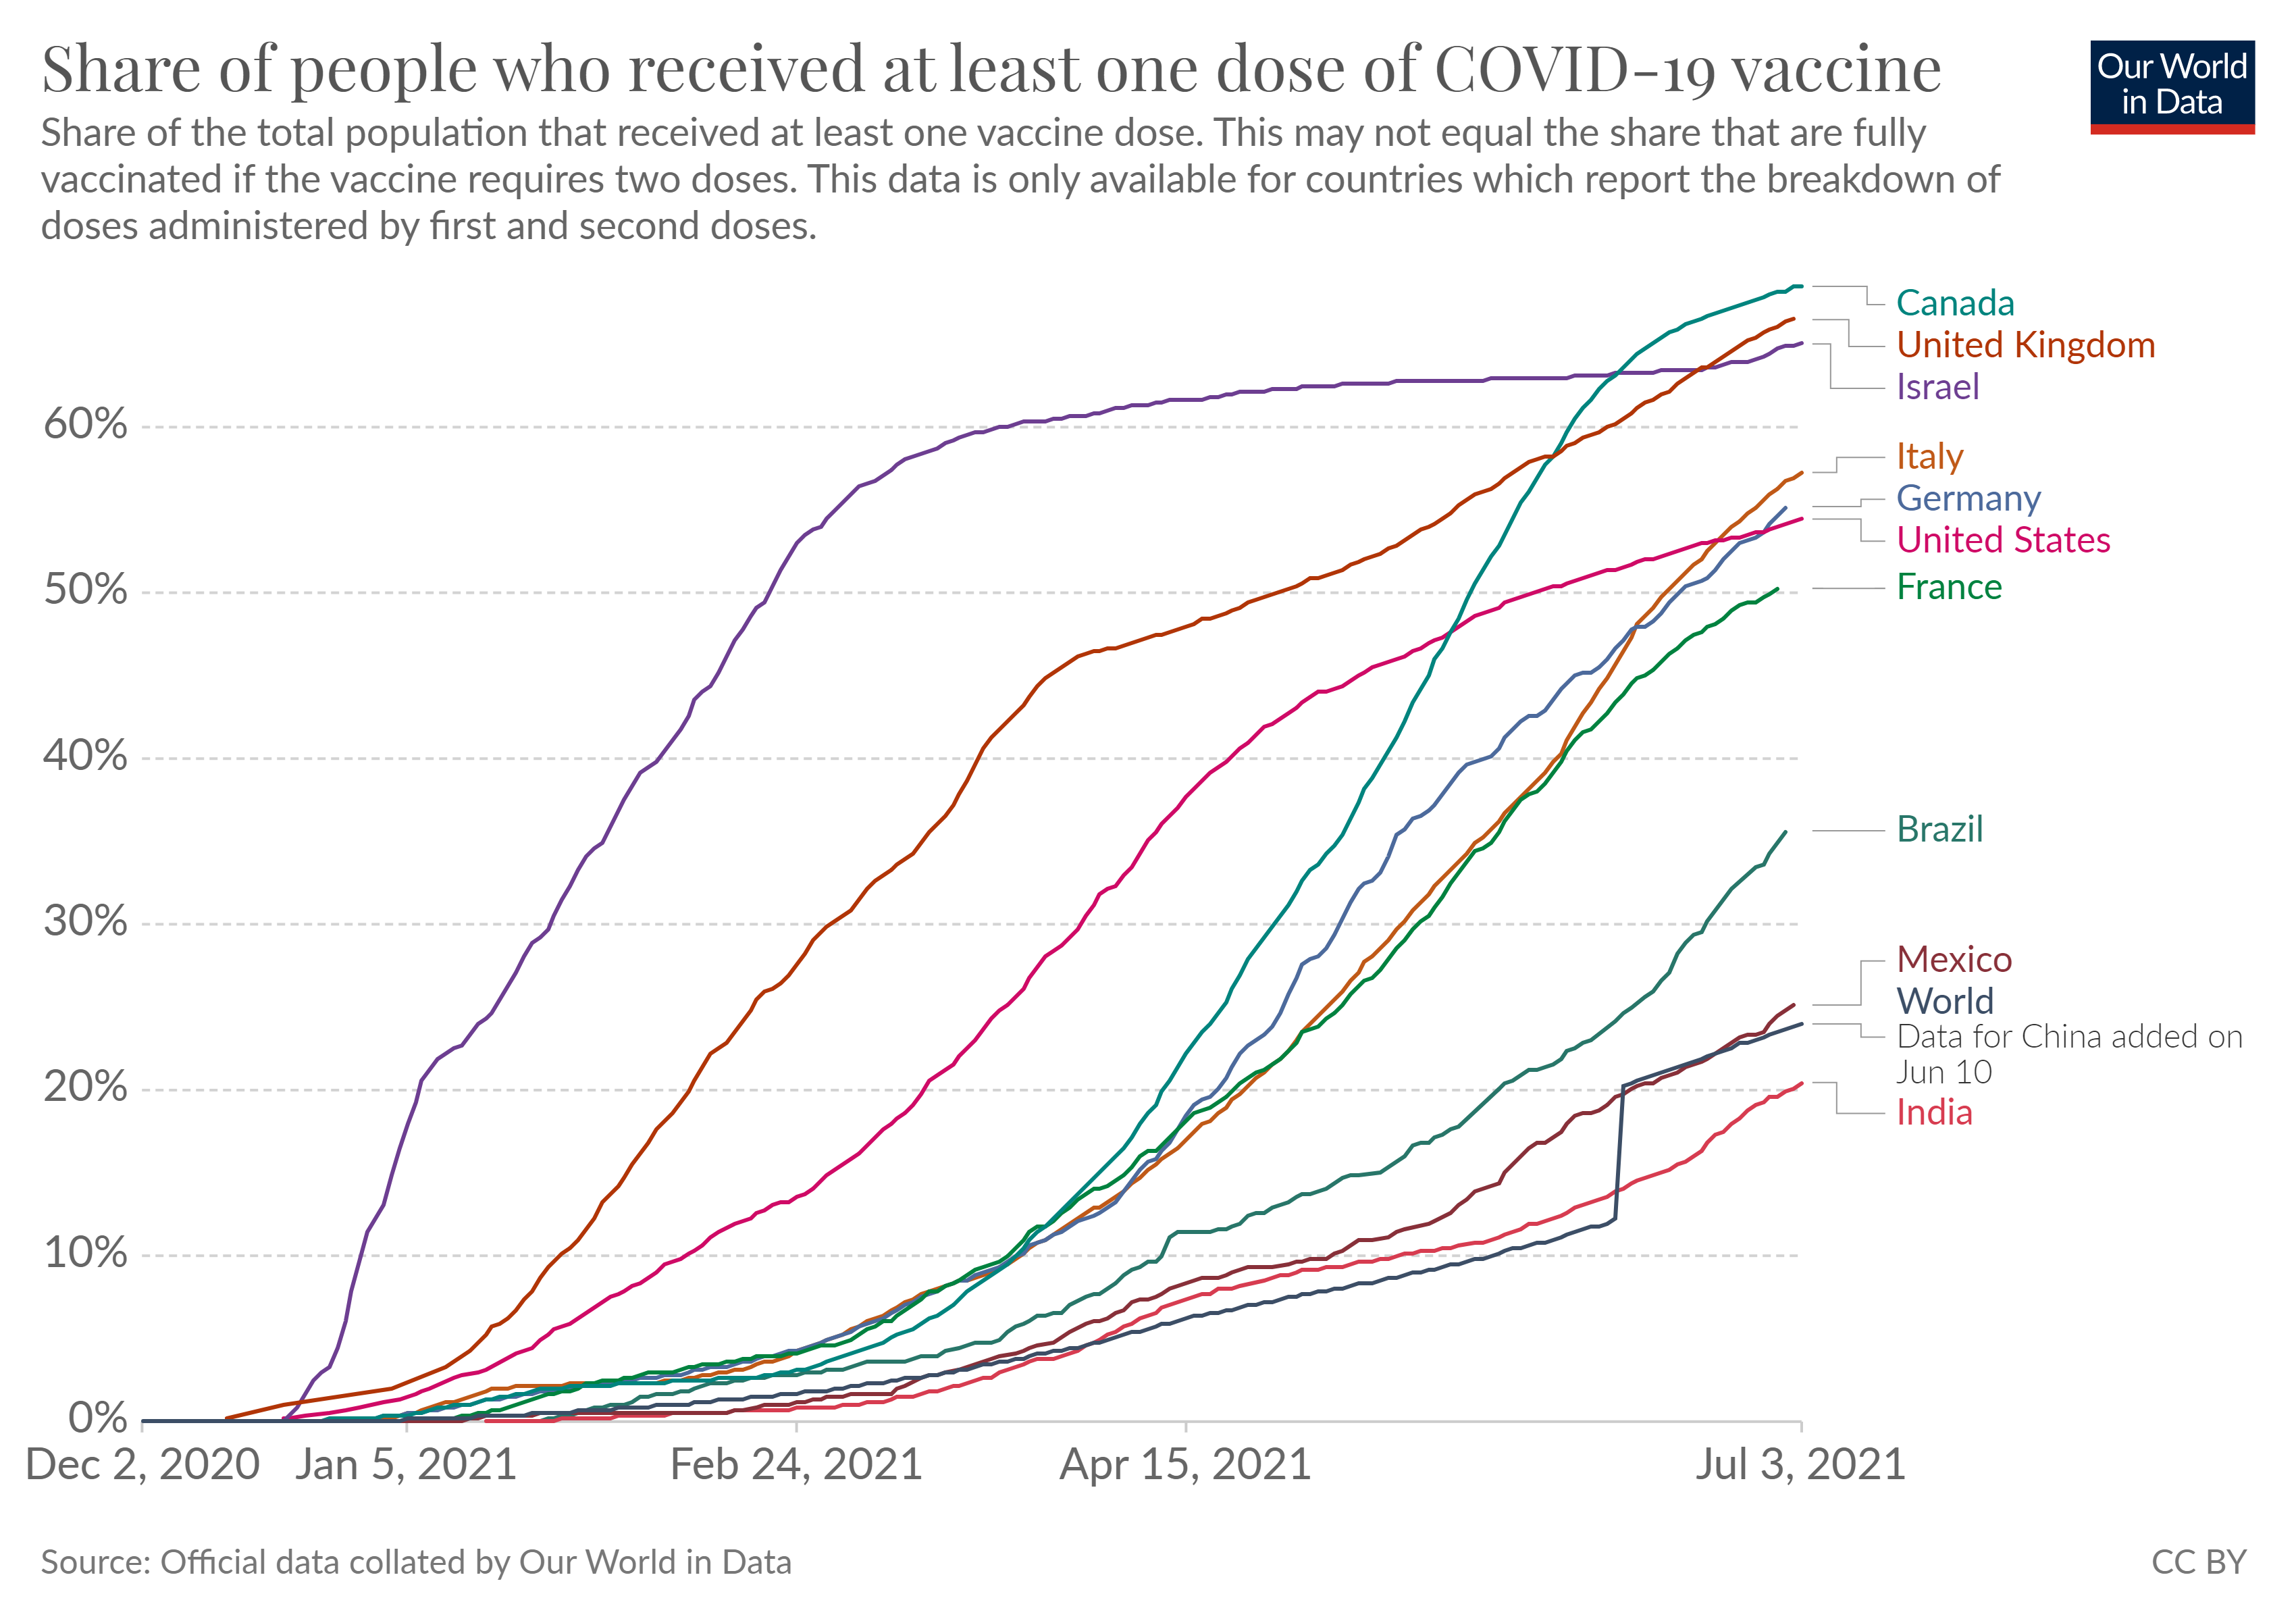
I co-authored a global public dataset that tracks the scale and rate of the vaccine
rollout across the world, which was published in Nature Human Behaviour
I was the primary contributor to a cross-country public dataset that tracked the scale and rate of
COVID-19 testing across the world, which was published in Nature Scientific Data
Data visualisations of air pollution, measured by NO2 μg/m3, its associated health
risks, measured by the number of asthma-related hospitalisations, and mean income in major cities.
Lobbying and Unions: The Influence of the American Legislative Exchange Council on
Right-to-Work Laws
A descriptive paper on the activity of the American Legislative Exchange Council, and the economic
models of rent seeking, unions, and collective action.
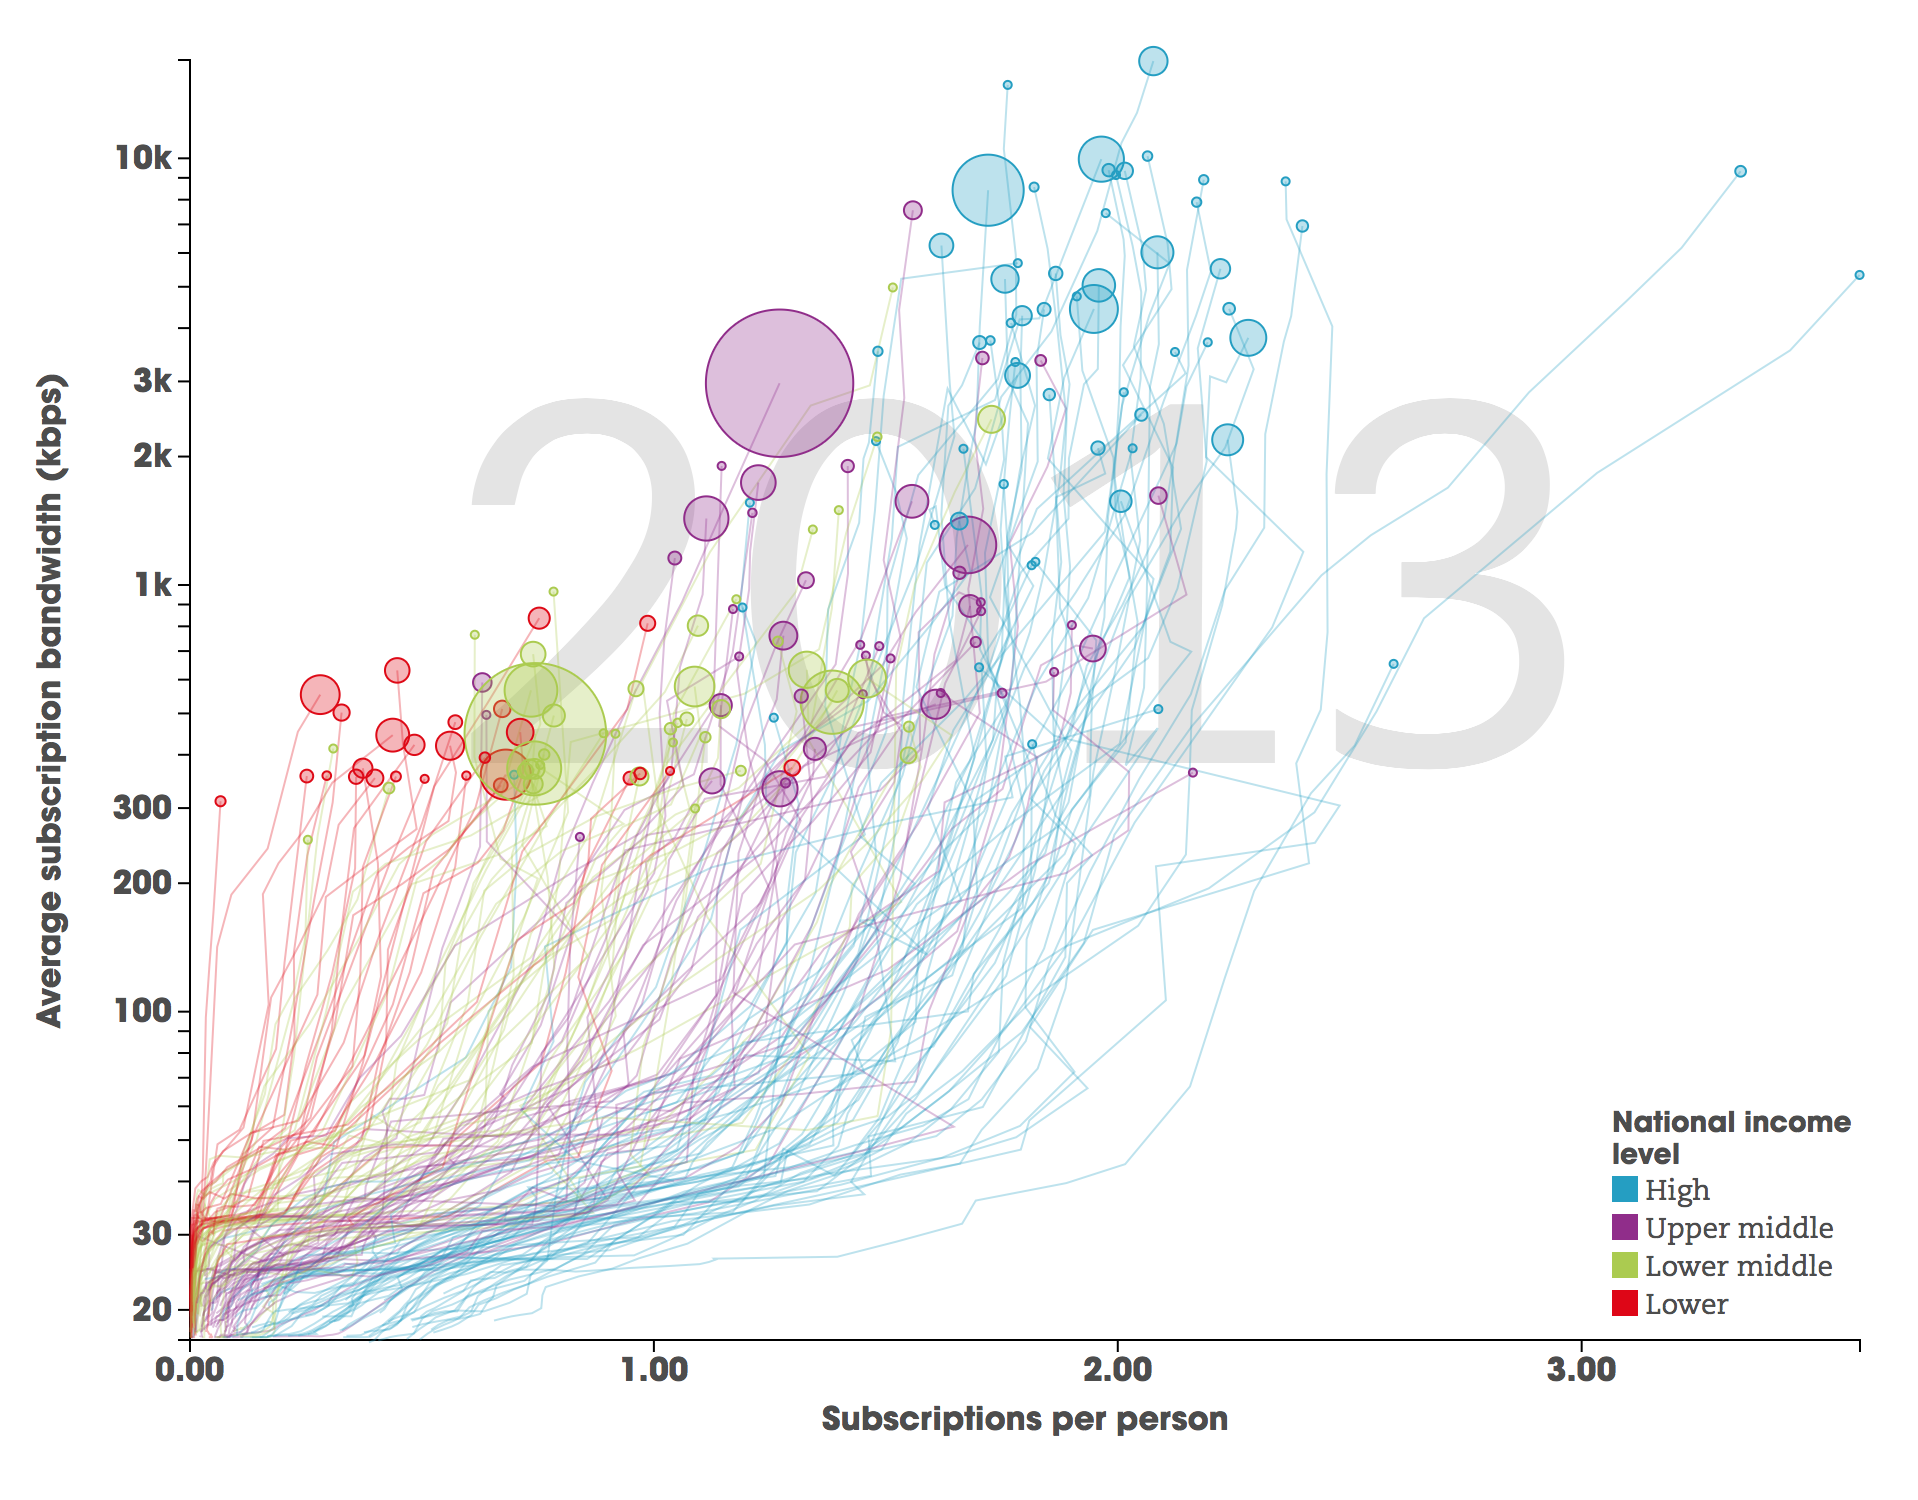
The Digital Divide is narrowing - but it's deeper than it looks
While almost half of the world’s population now have access to the internet, some concerning trends in
the diffusion of information and communication technology (ICT) have arisen. If left unchecked, these
patterns threaten to offset the potential benefits of the internet, and even perpetuate pre-existing
problems. This post discusses the nature and nuances of the Digital Divide.